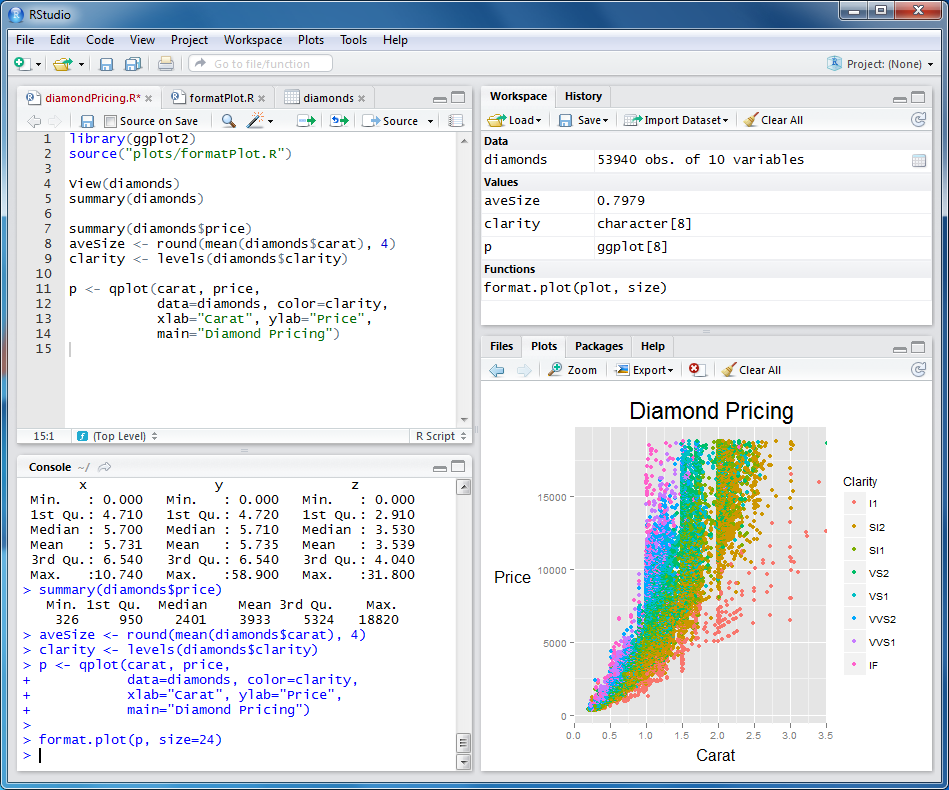
R Software, a free and open-source programming language and software environment, has become a cornerstone in the world of data analysis and statistical computing. Its roots lie in the academic community, where it was developed by statisticians Ross Ihaka and Robert Gentleman at the University of Auckland in the early 1990s. R quickly gained popularity due to its flexibility, extensive statistical capabilities, and vibrant community. Its open-source nature has fostered collaboration and innovation, leading to a vast ecosystem of packages that extend its functionality and address diverse needs.
Table of Contents
The language’s versatility allows users to manipulate data, conduct statistical analyses, create compelling visualizations, and build predictive models. R’s powerful features, combined with its user-friendly interface, have made it an indispensable tool for researchers, data scientists, and professionals across various industries. From exploring trends in financial markets to analyzing biological data, R plays a critical role in uncovering insights and driving data-driven decisions.
Package Ecosystem and Community

R’s strength lies in its extensive package ecosystem, which provides a vast array of tools and functions for various tasks. This allows users to extend R’s functionality beyond its core capabilities, enabling them to tackle complex problems in different domains.
Popular R Packages, R software
The vibrant R community has developed numerous packages that cater to diverse needs. These packages are organized into repositories, the most prominent being CRAN (Comprehensive R Archive Network), which houses a vast collection of packages. Here’s a table showcasing some popular packages categorized by their primary applications:
| Category | Package | Description |
|---|---|---|
| Data Science | dplyr | Data manipulation and transformation |
| tidyr | Data tidying and reshaping | |
| ggplot2 | Data visualization | |
| Machine Learning | caret | Machine learning workflow and model training |
| randomForest | Random forest algorithm for classification and regression | |
| glmnet | Generalized linear models with regularization | |
| Bioinformatics | Biostrings | Sequence analysis and manipulation |
| DESeq2 | Differential gene expression analysis | |
| phylogram | Phylogenetic tree visualization |
R Community Resources
The R community is highly active and supportive, providing numerous resources for users of all levels. Here are some of the prominent resources:
- CRAN: The primary repository for R packages, offering a comprehensive collection of packages, documentation, and tutorials.
- RStudio Community: A platform for asking questions, sharing knowledge, and connecting with other R users.
- Stack Overflow: A popular question-and-answer website where users can find solutions to coding problems and seek guidance from the R community.
- R-Bloggers: A blog aggregator featuring articles and tutorials from various R bloggers, providing insights into different aspects of R programming.
- R User Groups: Local groups that organize meetings, workshops, and events to foster collaboration and knowledge sharing among R users.
Comparison with Other Statistical Software

R is a powerful and versatile statistical programming language and environment, but it’s not the only option available. Understanding how R compares to other popular statistical software packages can help you choose the best tool for your specific needs.
Comparison of R with Other Statistical Software
Here’s a table comparing R with Python, SAS, and SPSS, highlighting their strengths, weaknesses, and use cases:
| Feature | R | Python | SAS | SPSS |
|---|---|---|---|---|
| Ease of Use | Steeper learning curve, but highly customizable | Relatively easy to learn, especially for those with programming experience | User-friendly interface, but less flexible for complex analysis | Intuitive graphical interface, suitable for beginners |
| Functionality | Extensive statistical packages, advanced modeling capabilities | Wide range of libraries for data analysis, machine learning, and visualization | Comprehensive statistical procedures, strong data management features | Basic statistical analysis, data visualization, and reporting |
| Community Support | Large and active community, abundant resources online | Massive community, extensive documentation, and online support | Strong corporate support, but less active open-source community | Smaller community, but some online resources available |
| Licensing | Open-source, free to use and distribute | Open-source, free to use and distribute | Commercial software, requires licensing | Commercial software, requires licensing |
| Use Cases | Data analysis, statistical modeling, visualization, machine learning | Data analysis, machine learning, web development, data science | Business analytics, data management, statistical reporting | Social science research, market research, survey analysis |
When to Choose R
R shines in situations where you need:
- Advanced statistical modeling: R offers a wide range of statistical packages for complex modeling tasks, including generalized linear models, time series analysis, and survival analysis.
- Customizable data analysis: R’s flexibility allows you to create custom functions and scripts for specific data analysis needs, making it ideal for complex research projects.
- High-quality visualizations: R’s graphics capabilities are unmatched, allowing you to create stunning and informative visualizations for reports and presentations.
- Open-source and collaborative environment: R’s open-source nature fosters collaboration and allows for sharing of code and resources within the community.
For example, a researcher studying the effectiveness of a new drug treatment might choose R to perform complex statistical modeling, analyze data from clinical trials, and create compelling visualizations to communicate their findings.
When to Consider Other Software
While R is powerful, it’s not always the best choice.
- Ease of use: If you’re a beginner or need a user-friendly interface, Python or SPSS might be better options.
- Specific industry requirements: SAS is widely used in the business analytics and financial sectors due to its robust data management features and compliance with industry standards.
- Cost considerations: Open-source software like R and Python are free to use, while commercial software like SAS and SPSS require licensing fees.
For example, a marketing team might choose SPSS for basic data analysis and reporting on customer surveys, while a financial institution might prefer SAS for its data management capabilities and compliance with regulatory standards.
Final Conclusion: R Software

R Software stands as a testament to the power of open-source collaboration and its transformative impact on data analysis. Its comprehensive capabilities, vast package ecosystem, and active community have made it an essential tool for anyone seeking to extract knowledge and meaning from data. As technology continues to evolve, R remains at the forefront of data science, empowering users to tackle complex challenges and unlock new possibilities in a data-driven world.

